 Using Reporting Trees in Sage Enterprise Intelligence
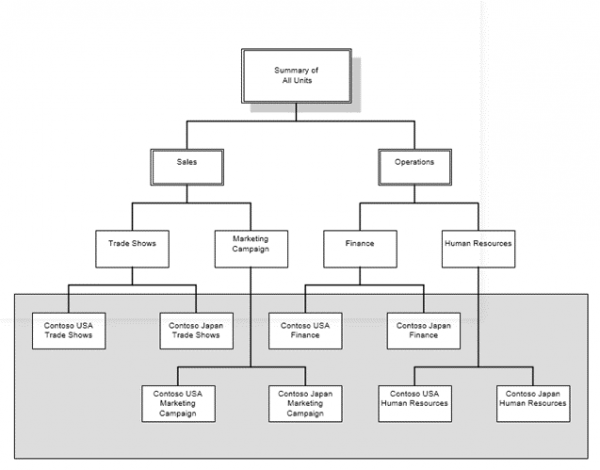
Reporting trees help define the structure and hierarchy of your organization. A reporting tree is a cross-dimensional hierarchical structure that is based on the dimensional relationships in your financial data. It provides information at the reporting unit level and at a summary level for all units in the tree. A reporting unit can be an individual department from the financial data, or it can be a higher-level summary unit that combines information from other reporting units.
Reporting trees increase the power of Sage Enterprise Intelligence (SEI)and support flexible reporting as the business structure changes. Financial reports that are not based on a reporting tree use only some of the capabilities of SEI. You can use multiple reporting tree definitions to view your organization’s data in numerous ways.


Reporting Tree Best Practices
Before you create a reporting tree, consider the following best practices:
- First determine which reporting dimensions your legal entity or company requires.
- Consider how you have set up your structure, and then draw an organizational chart of your company. The organizational chart will help you visualize how to group the reporting units into one or more reporting trees.
- Start with the lowest available level of detail, such as the departments and projects that are defined in the financial data. Add as many boxes to the level of detail as are required to show higher-level divisions or regions. Each box represents a potential reporting unit in any reporting tree that you create.
- You can use the reporting units that are defined in your financial data system to add reporting units to the reporting tree definition.
The following diagram shows an example of a reporting tree with an organizational structure that is divided by business function.
Creating a Reporting Tree
- In the Administration section, click on Reporting Trees in the left pane.
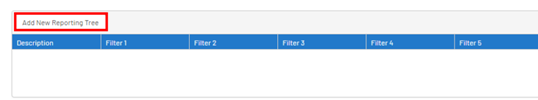
- In the left-hand corner, click on Add New Reporting Tree.
- In the Reporting Tree field, enter a name for the reporting tree.
- In the Filter drop-down lists, select the Global Parameters you want to use as filters. There can be up to 10 filters which can include Company, Site, dimensions, and any other parameter.
- The global parameters you define here will be used as values when you add a Root Level Filter.
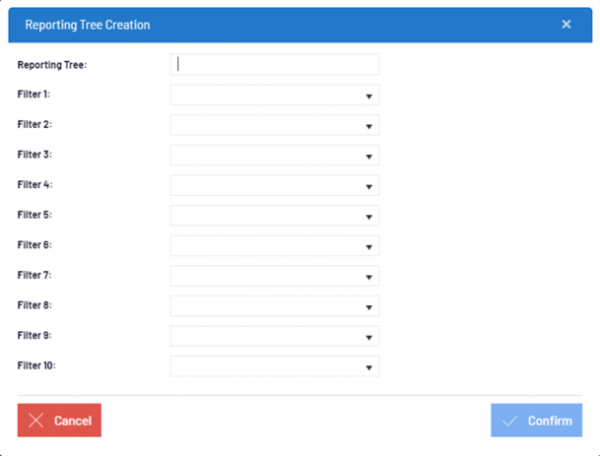
- Click on Confirm to finish.
Adding Root Level Group and Level Filter
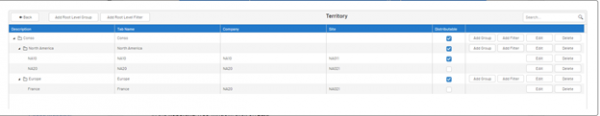
At the Level Group, the filters you define are gathered on each level from the Root (Root Level Filter) into a group so that the hierarchy stays organized and easy to navigate. It is here that you create the Nodes that will compose your reporting tree.
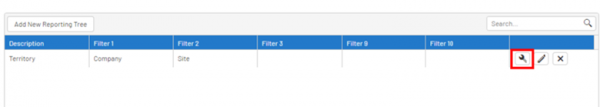
- In the Reporting Tree list, click on the wrench icon of the reporting tree you want to apply filters to.
- Click on Add Root Level Group to start defining the hierarchy of your filters:
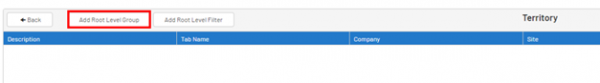
- In the Description field, enter a name for this group.
- In the second field, click on the paste icon to retrieve the value from the Description field or enter the name you want displayed in the tab of your Excel
- Tick the Distributable checkbox to make this node and the filters within this group available for the Distribution.
- Click on Save to finish the creation of your group.
- Click on Add filter to add filters to the group you have just created:
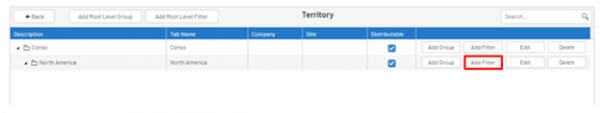
- In the Description field, enter a name for this filter.
- In the second field, click on the paste icon to retrieve the value from the Description field or enter the name you want to be displayed in the tab of your Excel
- Use the prompt to select a value in the Global Parameters.
- Select the Distributable option to make this node and the filters within this group available for the Distribution.
- Click on Save to finish creating your filter.
- Click on Confirm to create your structure.
Using the Reporting Tree in The Excel Add-In
Combined with the Excel Add-In, the reporting tree allows you to quickly and easily generate several reports based on specific nodes, all gathered in one place.
To use the Reporting Tree:
- In the Excel file, click on Reporting Tree in the menu options to select the reporting tree from which to retrieve the node. If you are not logged in (refer to Login to SEI Excel Add-in ) a pop-up window will appear so that you may do so.
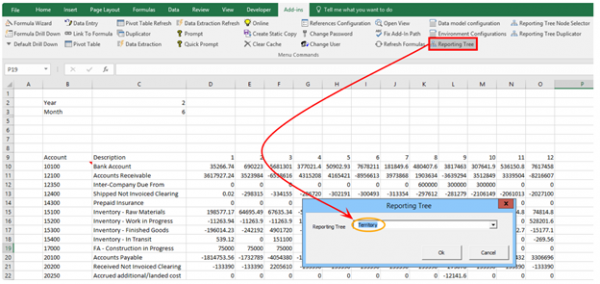
- Click on OK. NOTE: Only one reporting tree can be used per workbook.
- Select the cell in the sheet to be used as reference and click on Reporting Tree Node Selector in the menu options.
- Select the node from the reporting tree you want to retrieve the data. Here, we select the C4 cell and add a description in the B4 cell.
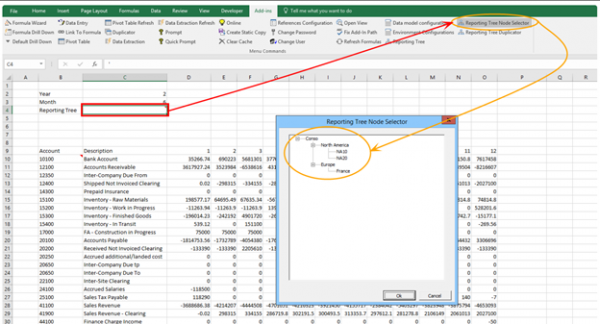
- Click on OK.
The reference cell is the cell that contains the data specific to the nodes existing in the reporting tree. It allows you to generate data dynamically when using a formula or pivot tables or performing a data extraction.
Using the Reporting Tree in Reports
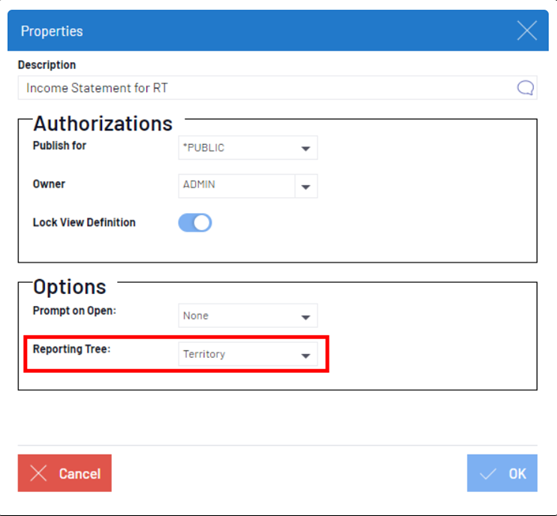
- In the Reports tab, right-click on a report and select Properties.
- Under the Options section, select the Reporting Tree you defined in the drop-down list and click on OK.
- Once the report is loaded, click on Reporting Tree in the right pane to reveal the tree architecture.
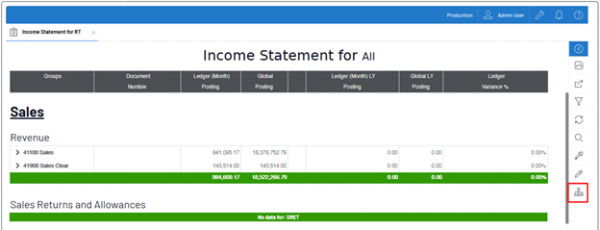
- In the Reporting Tree filter panel, click on one of the nodes to retrieve data and refresh the report.
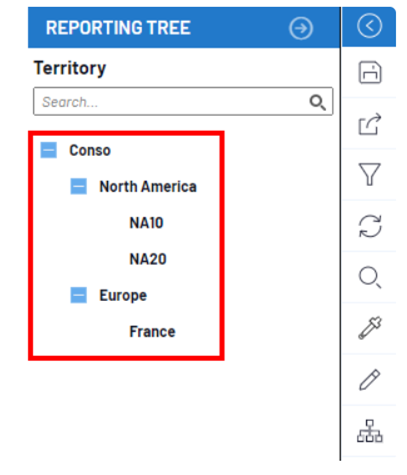
If you select a Group Node, (those represented by a +/- sign), it will automatically include its children (i.e., all the sub-groups and filters inside the sub-groups below this group).
Tip
For the title of your report, you can use the Dynamic Variables drop-down list to select your Reporting Tree. Using variables will automatically change the main title of your report when you select different nodes.
For more information on creating and using reporting trees in Sage Enterprise Intelligence, please contact us.