How to Create Specialty Manufacturing Reports in Sage X3
When you listen to a sales pitch on business intelligence, you may walk away more confused than when you started because, if you’ve been around long enough, you’ve seen many reporting tools – from Lotus to MS Excel to FRx to Crystal Reports, etc. You then hear about other reporting tools that are better suited for reporting financial data versus operational data; all of this can be confusing and overwhelming.
Ultimately, you come to the realization that many tools can do many things, as long as you have the expertise and the imagination to develop what you need. As we always tell our clients, one thing is for sure: if the data has been captured in the system, we can report on it! Here’s how to create speciality manufacturing reports in Sage X3.
Out-of-the-Box Options
Sage X3 comes with many reports, inquiries, and graphical requesters right out of the box, with no customizations. Another tool, Sage Enterprise Intelligence (SEI), also comes with many predefined cubes, reports, and dashboards.
One area we found lacking was comparing manufacturing standard data points vs. actual data points. This became sorely evident with a customer that “manufactures” pies. The operations team was coming off an implementation where manufacturing functionality wasn’t being used; one of the main motivations to implement Sage X3 was to gain detailed insights into their manufacturing performance.
What the Customer Wanted
The customer did a fantastic job of learning how they wanted to use Sage X3 and implemented the system in record time. When the time came to compare actual performance versus the standards they had defined, however, they were disappointed. You can do it out of the box, but it’s very cumbersome – one work order at a time – and there are reports that provide comparatives by product or work center, but they lack enough details to see trends and don’t work well in Excel.
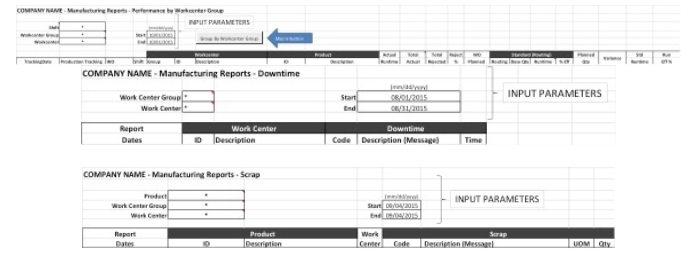
We used the customer’s criteria when creating the specialty manufacturing reports in Sage X3:
- Performance by Work Center Group: Actual run-time vs standard by Shift, Work Center Group, Work Center,
and Date Range - Downtime: Actual downtime by Work Center Group, by Work Center, and by Date Range
- Scrap: Actual scrap by Product, by Work Center Group, by Work Center, and by Date Range
How We Gave It to Them
In order to provide this information, we built views (cubes) that would be used within Excel using the SEI Excel add-in. Additionally, we used the power of macros in Excel and built a macro that takes the raw data and creates worksheets by Work Center so the customer doesn’t have to do this manually each time they refresh the data. And, since the customer wasn’t asking for something extremely detailed, we were able to develop a few reports that can be used by all. Here’s what each of the reports looks like (with data removed to protect the innocent):
Ultimately, this is another example of “If you can imagine it, we can build it.”
If you have questions about creating manufacturing reports, or questions about Sage X3 in general, please contact us.