
Sage 100 Newsletter – Q2 2020
Keeping You Up-To-Date With Information About Sage 100
Creating a Custom Financial Report in Sage 100
You can quickly create basic financial reports in Sage 100 including Income Statements, Balance Sheets, and Income Statement Trend Reports.
To do so, access the Financial Reports Wizard by opening General Ledger> Reports> Financial Reports. Then, click the “New Financial Report” button on the bottom left of the screen.
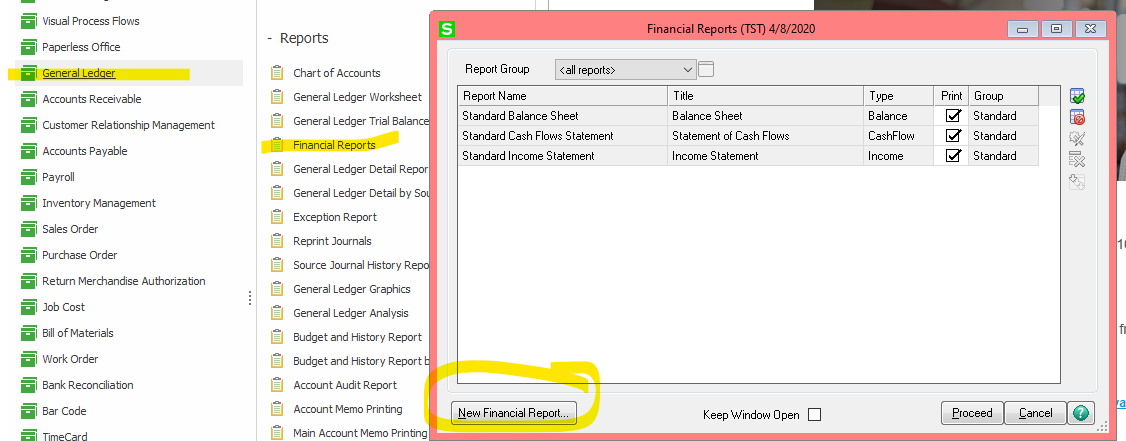
Enter a report name of your choosing and then select one of the available report types:
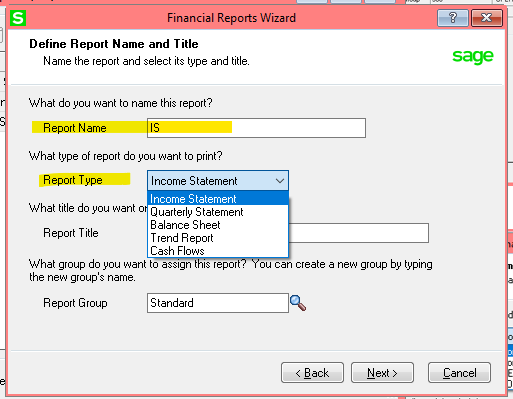
The Income Statement will display your revenue and expense by period.
The Quarterly Statement is also an income statement but will report by quarter.
The Balance Sheet will show your balance sheet accounts. (Assets, Liabilities, Equity)
The Trend Report will show income statement accounts (Revenue and Expense) for 12 months. (Note that this is an income statement trend and there is no balance sheet trend option. That would require Sage Intelligence Reporting.)
The Cash Flows will show how cash is generated and used in a period.
Sage 100 Reporting Options: Which is Best for You?
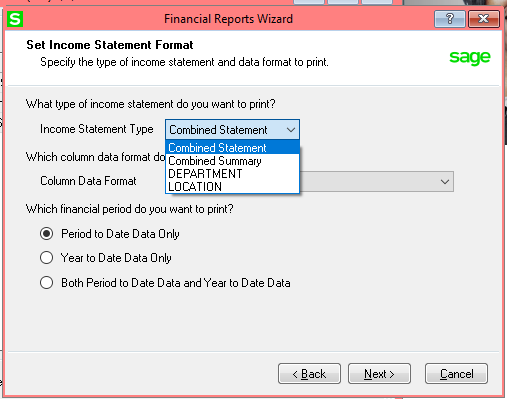
For our example, we’ll use the Report Type “Income Statement.” You’ll notice that there are several income statement types to choose from:
Combined Statement: This is a typical income statement listing each GL account separately.
Combined Summary: You may have this option if you have more than one segment in your GL account separated by a hyphen. (E.g. 2000-001). This format will rollup and summarize by the first segment of your GL account. In the case of 2000-001 this would sum all accounts between 2000-000 through 2000-999 and show the total for 2000.
My GL accounts happen to have 3 segments. The main account – Department – Location. E.g. 515–000–3000. For this reason, I also have “Department” and “Location” available under Income Statement Types. Choosing one of these options would summarize and page break by department or location. For this example, we will use the basic “Combined Statement.”
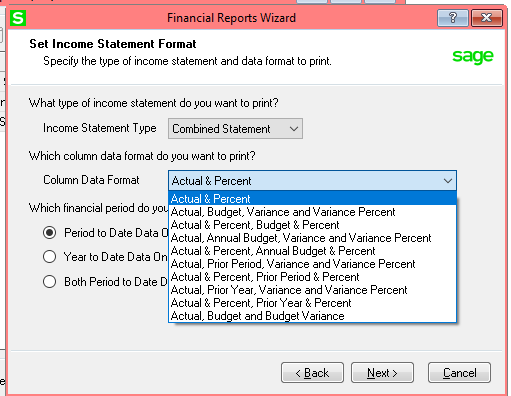
You’ll have several options for the data you would like to see displayed on this report. Choose one of the combinations of actual, budget, variance, variance percent, prior year, etc. See below for the full list of available options:
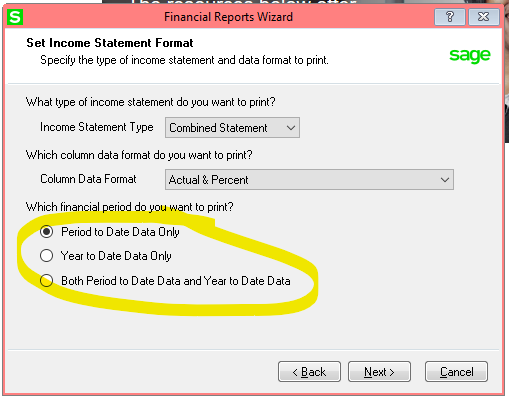
Then, select whether you want to display the current period to date, year to date, or both:
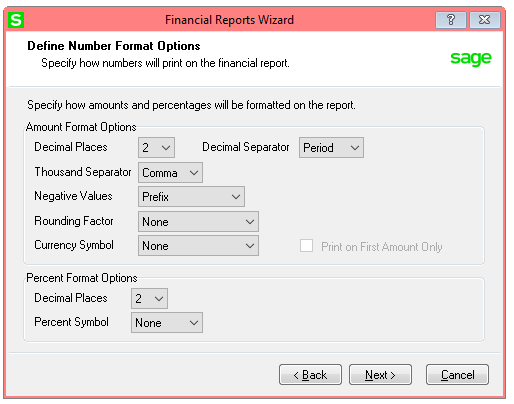
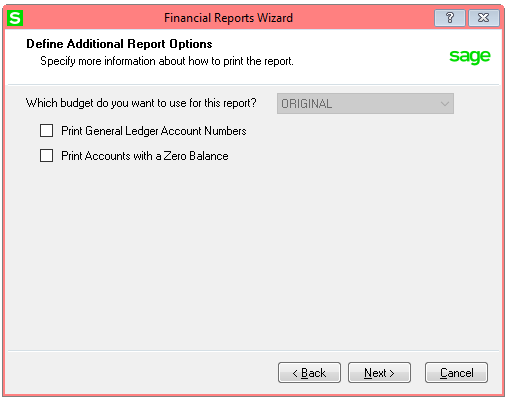
As you click the Next button to advance through the screens, you will have an opportunity to customize some features of the report such as decimal precision and currency symbols, whether to show account numbers (or just names), and whether to print zero balance accounts.
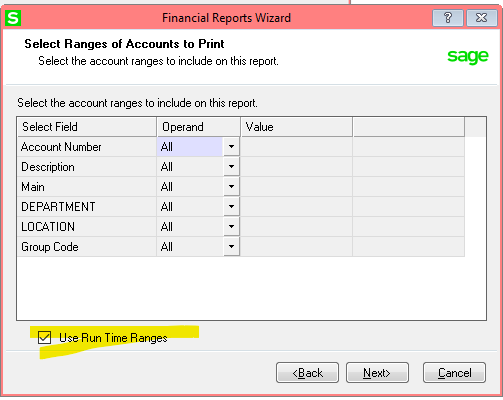
You can specify fixed filters into the report. For example, if you wanted an income statement for only a particular location, you could enter that now. If you want to have the flexibility of entering any filters at the time you run the report, check the box “Use Run Time Ranges.”
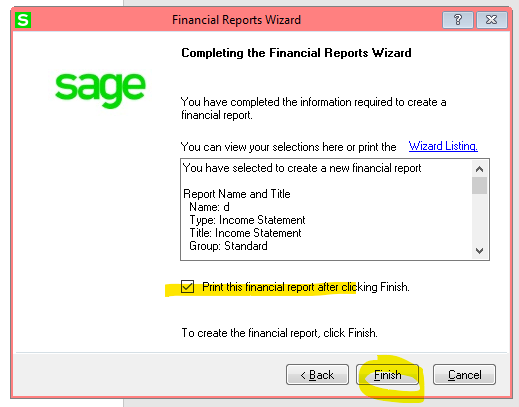
On the last screen, check the box to “Print this financial report after clicking Finish” and click “Finish” to launch the report you just created.
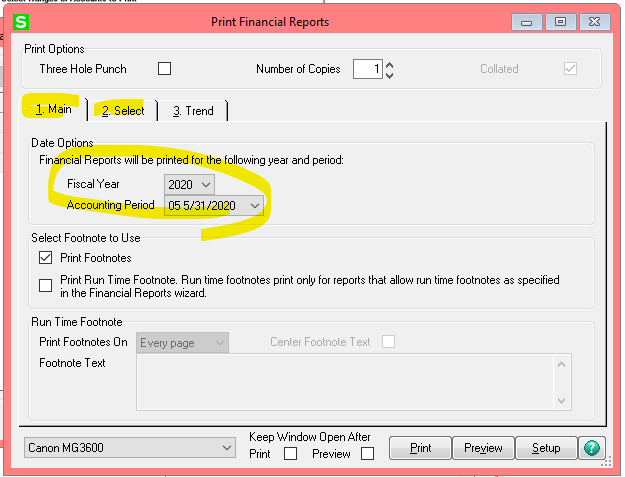
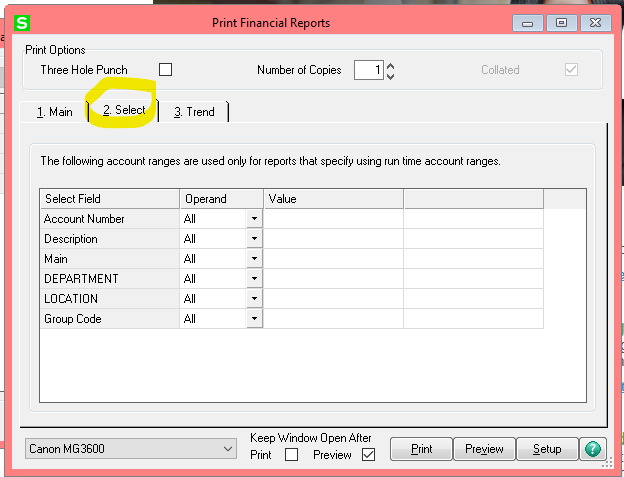
Enter the fiscal period you wish to display and use the “Select” tab if you would like to enter additional filters. Note that the “Trend” tab is only available for Trend type reports.
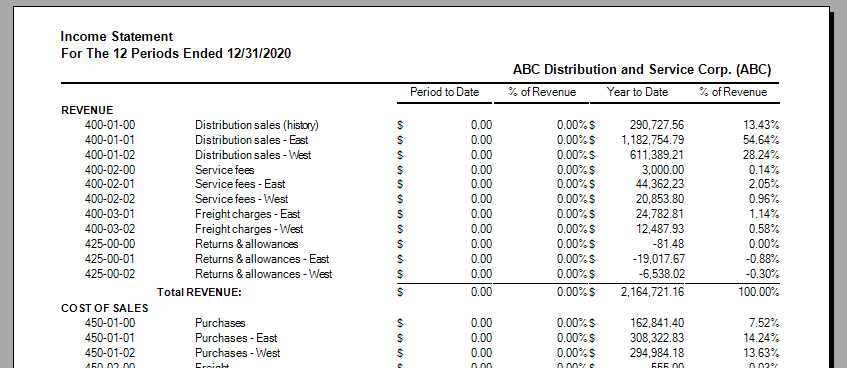
Click Preview to display the report:
If you’re looking for more advanced reporting capabilities, Sage Intelligence is a powerful reporting tool you can use to create and distribute reports.